Bitcoin (BTC) and the broader cryptocurrency market have seen slight gains in the early trading hours on Friday after the latest jobs report blew away expectations, with the U.S. economy creating 353,000 nonfarm payroll jobs in January versus the expected 185,000.
The blowout report added further uncertainty as to when the Federal Reserve will move to reduce interest rates, causing investors to reconsider their level of risk, which led to a loss of the price increase that Bitcoin and my other cryptos had seen before the release.
Data provided by TradingView shows that Bitcoin’s price whipsawed in response to the jobs report, initially plunging to $42,530 and then surging to $43,700, before ultimately returning to support at $43,000, where it now trades.
BTC/USD Chart by TradingView
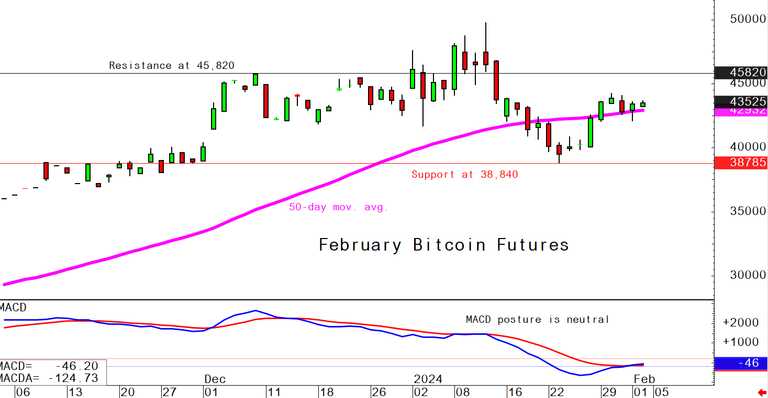
Kitco senior technical analyst Jim Wyckoff said that bulls and bears remain “level on an overall near-term technical playing field,” and the “direction in which prices break out above the resistance line or below the support line [on the chart below] will very likely be the next significant near-term price trend for Bitcoin.”

Bitcoin futures 1-day chart. Source: Kitco
Bitcoin’s price has managed to maintain its current support level in large part because outflows from Grayscale’s GBTC ETF have waned, while inflows into BlackRock’s IBIT ETF continue to rise.
According to Bloomberg Intelligence ETF analyst James Seyffart, IBIT became “the first ETF to trade more than Grayscale’s $GBTC in a single day.”
Data provided by The Block shows that IBIT saw $303.97 million in daily trading volume on Thursday, compared to $292.37 million for GBTC, while Fidelity’s FBTC ranked third with $171.84 million.
Nate Geraci, president of the ETF Store, noted that IBIT surpassed $3 billion in assets in three weeks and is “Now in the top 10% of *all* ETFs by assets.”
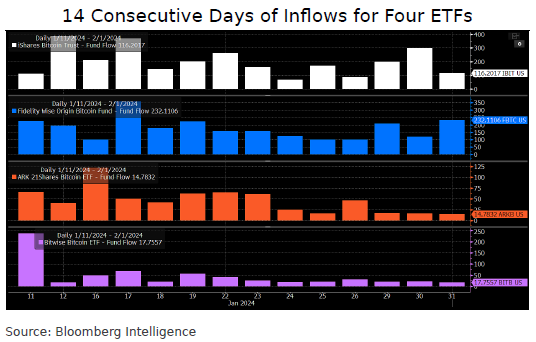
He also highlighted that “IBIT, FBTC, ARKB, & BITB have all posted inflows on *each* of their first 14 trading days. By contrast, GBTC [has seen] outflows *every* day since converting into an ETF.”

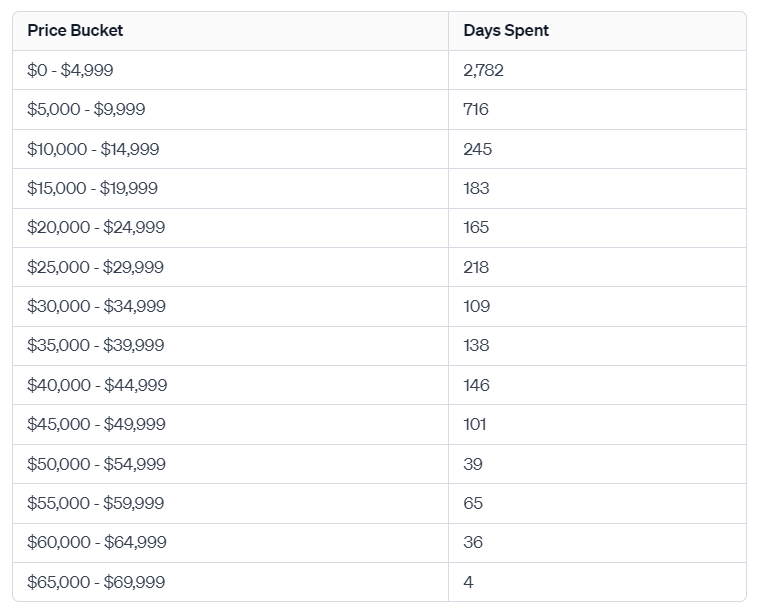
But despite the focus on ETFs and inflows, CryptoSlate research and data analyst James Van Straten noted that Bitcoin has spent nearly 150 days in a $5,000 price corridor, which is “characteristic” BTC price behavior during bull markets.
“Digging deeper, the price analysis in $5,000 increments reveals a pattern,” Van Straten said.
“Bitcoin has been trading within the price range of $40,000 to $44,999 for 146 days. This duration has recently overtaken its previous stint in the $35,000 to $39,999 range, which spanned approximately 138 days.”
“When assessing price increments from $10,000 and upwards until $49,999, it becomes apparent that Bitcoin typically trades within these ranges for a period between 100 and 250 days,” he added. “Thus, the current sideways price action aligns with Bitcoin’s historical trading patterns and can be considered characteristic behavior, not an anomaly.”

“We could see more sideways chop until halving which takes us up to circa 250 days,” he concluded.
With BTC bulls struggling to generate momentum for a push higher, many in the ecosystem now think that a major breakout will not take place until several months after the halving.
Here’s the road map
March – May – BTC has a slight up tick from halving FOMO.
May – Sept – BTC chills out
Sept – Oct – BTC starts its incline
Nov – Jan – ALT season
Feb – Apr – BTC blow off top
Now until Forever – Any random ALT can go 10x; good luck
— Cobra Crypto (@CobraCrypto) February 1, 2024
And with the new Bitcoin emission rate set to fall to 3.125 BTC after the halving, a growing chorus of hodlers see the ETFs and institutional adoption becoming more of a factor in Bitcoin’s price than halvings moving forward.
Indeed, the top 2 bitcoin ETFs are enabling the buying of ˜9k BTC a day, which is 10x more than total mining supplies per day, and in 3 months (after the halving) that’ll be 20x more. The ETFs are a huge deal. https://t.co/IfgloPh23m
— Tuur Demeester (@TuurDemeester) January 29, 2024
Disclaimer: The views expressed in this article are those of the author and may not reflect those of Kitco Metals Inc. The author has made every effort to ensure accuracy of information provided; however, neither Kitco Metals Inc. nor the author can guarantee such accuracy. This article is strictly for informational purposes only. It is not a solicitation to make any exchange in commodities, securities or other financial instruments. Kitco Metals Inc. and the author of this article do not accept culpability for losses and/ or damages arising from the use of this publication.
This news is republished from another source. You can check the original article here

